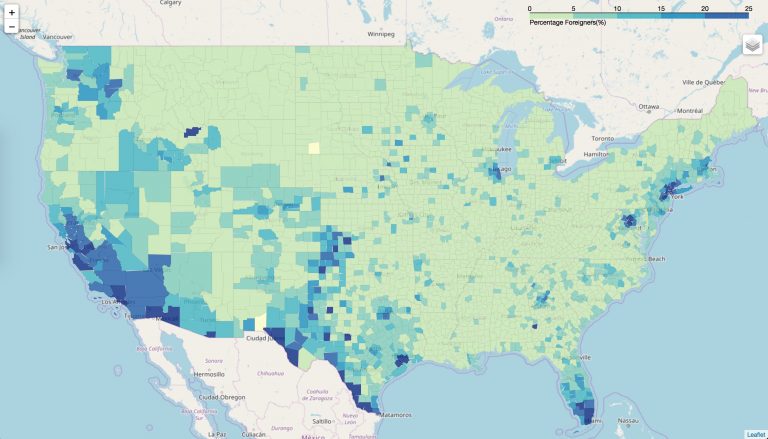
Building maps is very easy with Folium. I got my hands on some data from the US Census, specifically, the foreign born population and total population per US county.
To plot it, first download the CSV from the 2011-2015 American Community Survey 5-Year Estimates.
import os
import folium
import pandas as pd

# Load data
data = pd.read_csv('data.csv')

# Add column with ratio of foreign born vs total pop.
data['ratio_foreign_born_vs_total_population'] = 100 * data['Estimate; Foreign born:'] / data['Estimate; Total:']

# Create map
map_1 = folium.Map(location=[39, -96], zoom_start=4)
high_res_county_geo = os.path.relpath('gz_2010_us_050_00_500k.json') # from http://eric.clst.org/Stuff/USGeoJSON

# Add choropleth layer
map_1.choropleth(
 geo_data=high_res_county_geo,
 name='choropleth',
 data=data,
 columns=['Id', 'ratio_foreign_born_vs_total_population'],
 key_on='properties.GEO_ID',
 fill_color='YlGnBu',
 fill_opacity=0.8,
 line_opacity=0.05,
 legend_name='Percentage Foreigners(%)',
 threshold_scale=[0, 5, 10, 15, 20, 25]
)

folium.LayerControl().add_to(map_1)

# Save as index.html
map_1.save('index.html')
The result: