
For those of you that have never played SET® before, SET® is a fast-paced game involving 81 unique cards with different combinations of four characteristics (color [red, green, or purple], shape [diamond, oval, or squiggle], shading [hollow, shaded, or filled], and number [1, 2, or 3]). The point of the game is to find as many 3-card “sets” as possible. If the three cards are either all the same or all different in each of the four characteristics, you know you’ve found a set. Twelve cards are presented on the table at a time, and are continually replenished when a set is taken out, until no cards remain in the deck. Sometimes, however, there are no sets in the twelve cards, in which case 3 more cards are dealt. But, how do you know if there really is no set? I aim to solve this problem using image processing software and eventually create a set recognition mobile application.
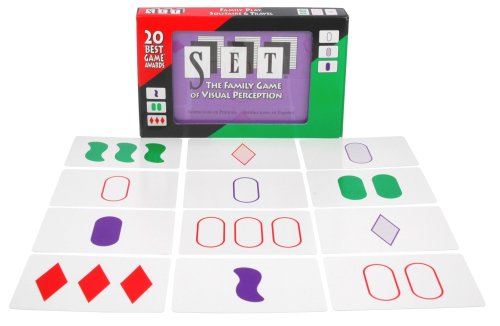
So, what determines a set? Let’s take the example below (although it is probably one of the most difficult sets in the game). Looking at the cards in terms of the four characteristics, we have the following: color - red, green, and purple (all different); shape - diamond, oval, and squiggle (all different); shading - filled, hollow, shaded (all different); number - 1, 2, 3 (all different). If the cards were exactly the same, but all red, this would also be considered a set, because, in terms of color, they are all the same.
There’s the simplified breakdown of how I used an image processing algorithm to determine sets from ordinary jpeg images:
Step 1: Convert the image to black and white and invert the image to calculate the number of shapes per card
Step 2: Compare the pixel surface area of one of the symbols on each card to determine the shape
Step 3: Normalize the RGB color of the images with an equation to figure out the color
Step 4: Convert the images to gray scale and apply a border detection to determine the shading
Step 5: Run the simple algorithm that deduces the sets
Introduction
The Set deck contains 81 unique cards, unlike a normal deck which contains only 52. Furthermore, there are more features to detect in Set (color, shape, amount, and shading) than in regular playing cards (number and suit). Although it is true that regular playing cards have color features (red and black), this information is redundant because the suit of a card reveals the color (i.e. hearts and diamonds are red; clubs and spades are black). For this reason, the regular playing card recognition systems use a gray-scale image to simplify the process. This type of simplification, however, is not possible in Set , as the color information is required. The solution to the problem of identifying all four features in Set , including both color and shading, could be used to build a mobile application that could solve the game from a single image. Furthermore, the same principles used to recognize shading and color could be applied to other systems to ensure a more reliable analysis. In playing card games like blackjack, for example, in the case of overlapping cards (in which the suit
of the only revealed corner of a card cannot be recognized with 100% accuracy), taking the color into account might enable suit identification by using the process of elimination (i.e. a large rounded edge can only be a heart or a spade, which is either red or black)
In this way, the identification of color and shading features could add robustness to both regular card game recognition systems as well as other non-card-related recognition systems (i.e. to identify items in a factory, suitcases in an airport, etc.).
MATERIALS & METHODS
<pBelow, we will first briefly explain how the game Set is played. Then, we will mention our motivation for conducting this particular image processing study using Set cards and our specific research goals. Finally, we will detail how the algorithm identifies not only the card borders but also the specific features of the cards
A. The Game
Set is a card game consisting of 81 cards, each of them having 4 features with three different possibilities. Each com-bination of features appears once and only once in the deck (34 = 81).
- Color: Red, Green, or Purple
- Amount: 1, 2, or 3
- Shape: Rhombus, Squiggly, or Oval
- Shading: Hollow, Striped, or Solid
- They are all the same color, or each of them are three different colors
- They all have the same amount, or they each have three different amounts
- They are all the same shape, or each of them are three different shapes
- They all have the same shading, or they each have three different shadings
When a player finds a Set, he/she collects the three cards that make up the Set, adding them to his/her pile of Sets
In an attempt to use image recognition technology to analyze photos of Set cards, we simulated a game of Set, pausing to take pictures whenever cards were replaced. These pictures were then individually analyzed using Matlab’s image processing toolbox to identify the specific features of the cards. The goal of this study consisted in identifying any and all Sets in a given group of cards (in this case twelve), with the hope of eventually using the same technology to create a mobile “Set-recognizing” application
The experimental set-up consisted of a cell-phone with a camera (an iPhone 4, which has a resolution of 5 Megapixels) situated 50 cm above the ground and completely horizontal thanks to a support system (Figure 2). The cards were placed on a paper sheet, on which 12 parcels of 8 cm x 5 cm had been previously drawn. Each card was placed into one parcel.
All pictures were taken in the proximity of a window with natural light, and to compensate for the fact that the light only came from one side, a lamp was placed and lit on the opposite side. For the same reason, all pictures were taken in a short period of time to ensure no changes in the natural lighting condition.
A total of 25 photographs were taken for analysis. The selection and removal process of cards for each photograph was similar to that of a real game. More specifically, to begin the simulation, we dealt out 12 random cards from the top of the shuffled deck. After taking a picture of this initial set-up, we manually found and removed one Set. These cards were replaced with three new ones from the deck, and another picture was taken. This process continued until no cards remained in the deck.
It is important to mention, however, that once, no sets could be found. In this instance, because we had limited the paper stencil to 12 parcels, we could not add three more cards like in a real game. Thus, we randomly selected three of the laid-out cards and replaced them with three new cards from the deck to continue the simulation.
Once all 25 photographs were taken, they were cropped to eliminate unnecessary components for the analysis (in this case, the background of the floor). Before analyzing the features of the cards, we created an algorithm to perform some basic transformations of the images to ensure that the patterns would be recognizable. These basic transformations include trimming the image, re-sizing it to a smaller size, and transforming it into a black and white picture, as color is not necessary for the identification of certain features.
The main purpose of this operation was to segment the original picture into 12 fragments, each containing only one card. Not only did this make feature classification easier, but it also allowed the algorithm to run in parallel, which ensured an optimized output in terms of speed in case more than one execution thread is available, as then cards can be processed individually in different threads speeding up the process. Because the paper stencil maintained card location, the coordinates used to cut the image were randomly extracted from one of the 25 pictures and maintained throughout the rest of the image analysis. Obviously, this solution would not be possible with a mobile application, but a similar alignment could be maintained on a mobile implementation with grids projected on the screen during picture-taking to communicate necessary adjustments. In this manner, the space between cards, as well as the distance of the camera from the cards, would remain rather uniform. In case the picture was not taken horizontally, we could use the information about the phone’s angle (extracted from the accelerometer) to correct the perspective.
After performing these basic transformations, we decided to address the problem of identifying card features one at a time. More specifically, we adjusted the algorithm to detect the four different features of the cards in the following order: amount, shape, color, and shading
E. Detecting Amount
In order to detect the amount feature, cards were first converted into black and white images. The images were then inverted and all enclosed figures were filled with white. Finally, the noise and artifacts such as shadows were removed, as can be seen in the bottom row of Figure 4. With this image, we applied the function regionprops from MatLab’s Image Toolbox, which returns a data struct containing statistical information about objects, to detect the number of shapes in each card. According to this function, the number of objects in each card is simply the length of the returned data struct. An object by this function is defined as an association of pixels different from those connected in the background.
F. Detecting Shape
The same inverted black and white image that had been treated for noise to recognize objects for amount detection was also used for shape detection. In this case, however, instead of further adapting the images, we had to further analyze them. The key to detecting shape is the well-differentiated surface area between the three possible objects (diamond, oval, and squiggly). The surface area can be calculated by simply counting the non-background pixels for one of the objects in the image. The same function regionprops used previously for amount detection also provides information about the area, so we could directly use this information to classify the cards. We also tried using other features such us eccentricity and perimeter to classify shape, but they were not successful because at least two of the three possible figures for each of those features had a similar magnitude in the selected feature space.
The parameter adjustments were experimented with using only one image for each shape until no errors were observed. Only then were they tested on and applied to the remaining images in the database.
F. Detecting Color
The most difficult feature to measure due to the limited capabilities of the smart-phone camera was the color. Different approaches were tested with varying results. First, we tried using the smart-phone’s flash to take the pictures, but this produced not only saturated images but also images with undesirable reflections. Then, we applied the CIELAB color space, which partially removes the impact that lighting has on pictures, approximating the human vision system. This approach offered acceptable results but mis-classified a number of the cards, so it was abandoned. Ultimately, we normalized the RGB color, which offered the best performance. In order to normalize the RGB color of the figures, we used the following equations:
An untouched image and its respective image after the RGB normalization process can be seen in Figures 5 & 6, respectively. In the normalized images, threshold values were set for the RGB components, so that the features would be forced into one of the three possible groups (red, green, or purple)
F. Detecting Shadingh5>
In order to detect the last feature, the filling of the card, we adapted gray-scale images of the cards. Similar to the color detection algorithm, a number of different approaches were attempted before finding the optimized solution, which is based on edge detection.
The difference between a solid, striped, and hollow figure is the number of borders, which can be detected by inverting the image. More specifically, a solid figure has only one border, a hollow one has two borders (one on the outside and another on the inside), and a striped one has many borders. In order to detect the edges of the figures, we performed the MatLab function edge , using the roberts method with a threshold value of 0.05 . Gray-scale images of three figures with distinct shading as well as their respective inverted border-detection images after applying the MatLab function can be seen in Figure 7
Finding “Sets”
Once the four features of the cards are successfully de- tected, the implementation of the algorithm to detect any and all Sets is quite straight-forward. The code, which is based on the definition of a Set, is quite simple and requires no further comment. The algorithm runs through each image of the game individually (each with 12 different cards laid out), applying all of the previously mentioned image adaptions to detect the four features and define the cards based on these. Then, the algorithm detects all possible Sets, assigning one of eight symbols (+, -, *, S, ?, 0, X, #) to any three cards that form a Set. An example of a solved image (with all identified Sets marked with matching symbols at the top of the cards) can be seen in Figure 8.
In this section the results of the system are analyzed from two points of view: 1. the number of correct classifications that the system achieved, and 2. the improvement in execution time when the algorithm was run in parallel. A. Classification Accuracy After processing all cards in the database (300) and de- tecting all Sets, we compared the results of our algorithm with those of an experienced human player. With this blind comparison, our algorithm did not perform one single error in terms of identifying Sets. Therefore, we can conclude the success of our detection algorithm. B. Parallel Computing Improvement Using MatLab’s Parallel Computing toolbox (more specif- ically, the function parfor that runs a for loop in the available threads), the algorithm performed approximately 3.5 times faster. We measured the classification time for five different images with the function cputime , which minimizes the effect of the operative system and other types of interference. The mean, maximum, and minimum time for these five classifica- tions using both serial and parallel computation are displayed in Figure 9 In this work a complete system able to detect features on cards, and effectively “play” a card game by finding Sets was implemented. This shows the feasibility of developing mobile applications that could solve logical puzzles (cards, chess, etc.) relying on a limited quality photo. Such systems would also be interesting for security and surveillance purposes. For example, casinos, which invest large amounts of money in detecting cheaters (players that are counting cards, etc.), could use a system such as the one presented here to reliably detect the cards on the table, as well as the chips with slight modifications to the code. The system could also incorporate an algorithm to automatically indicate when cheating patterns are detected (for example, increasing the bet in blackjack as the card count goes up) and set off an alarm. The system reached the maximum performance for the available data set, suggesting that certain aspects could be pushed more towards the limits. Orientation of the cards seems an obvious option but this modification is not likely to produce different results as long as the cards remains in their parcels. One aspect could be the light of the scene, and further studies should investigate on this aspect Because of the poor representation quality of the smart- phone’s CCD, the least robust detectors in the system are probably the color and shading ones, which both rely on components of the RGB image. Little can be done to change this limitation, as mobile phones have already been built to rely on these RGB components. We came up with a number of potential solutions as to how to neutralize this limitation and correct the colors on the smart-phone image. First, we tried to implement the use of the flash of the device. Unfortunately, however, upon implementing this solution, we realized that the saturation of the cards reflect light, making image recognition quite difficult on the parts of the image with glare. Moreover, thinking about a casino implementation, this solution of using a flash camera is unlikely, as constant flashing at the tables could bother/distract clients. The second solution we came up with was to use a different color space, such as Lab , that does not modify a and b components in different lighting conditions. This option, however, did not work as well as expected. For this reason, we decided to implement our third solution: normalizing the colors (as explained in equations 1, 2 & 3 above) and adjusting the parameters for our particular lighting condition, tweaking them until they allowed for the biggest possible margins without producing any errors. Regarding the segmentation of the image, it could be argued that we only have the information for the segmentation when working offline and with pictures taken in the same conditions. However, it should be pointed out that the position of the cards is not always the same: the only condition is that only one card is placed in each of the boxes, and these boxes could be made as big as needed. On a smart-phone application, when it comes to taking the picture, a grid-like pattern could appear over the image that is going to be taken, to ensure that only one card fits into each of the boxes formed by the lines. Similarly, in a casino, the dealer could be trained to place the cards in the same place every time to respect the segmentation margins. These two solutions would have the same results as our paper stencil in terms of maintaining card separation and size for segmentation.
Conclusion
This work shows the feasibility of an inexpensive system based on a smart-phone camera to solve the Set card game. With simple image processing techniques we were able to achieve a classification accuracy performance of 100%, sug- gesting that the presented work could lead to a system to analyze different card games such as poker or blackjack
For more details, check out the paper I wrote.